Columns under Combined Axial Load and Uniaxial Bending (SP 16 Interaction Diagrams)
In this chapter (4 topics)
On this page
- 1. Introduction & Mechanics of Combined Compression and Bending
- 2. Limit State Assumptions & Strain Profiles across Depth D (Clause 39.1)
- 3. Stress Block Integration & Section Equilibrium (Annex G)
- 3.1 Case 1: Neutral Axis Within Section (xu ≤ D)
- 3.2 Case 2: Neutral Axis Outside Section (xu > D)
- 4. The Pu - Mu Interaction Diagram
- 4.1 Significant Landmark Points on the Interaction Diagram
- 4.2 Failure Modes: Compression Failure vs Tension Failure
- 5. SP 16 Design Aids Formulation & Non-Dimensional Parameters
- 5.1 Non-Dimensional Chart Axes
- 5.2 Governing Parameters for Chart Selection
- 6. Engineering Diagrams & Detailing Anatomy
- Diagram 1: Column Uniaxial Bending Strain Profiles & Stress Block Integration
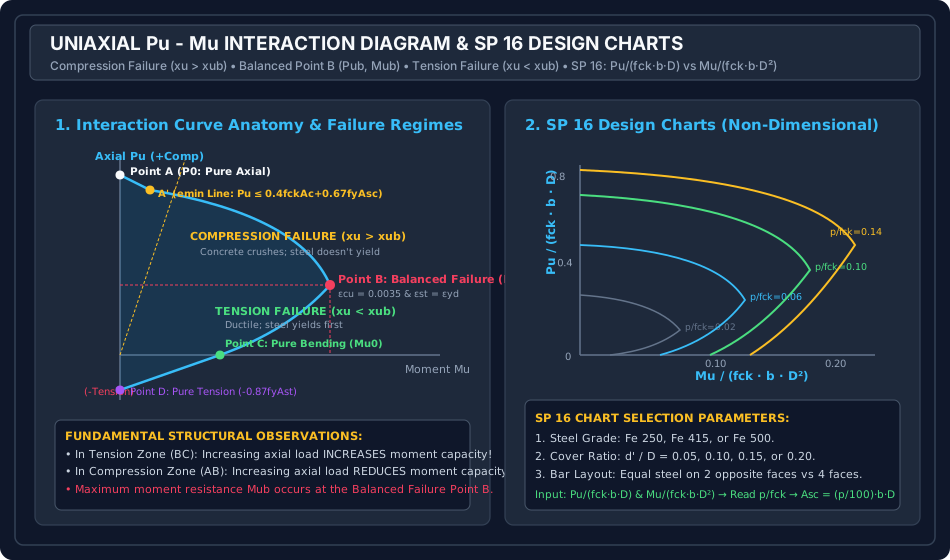
- Diagram 2: Uniaxial Pu - Mu Interaction Diagram & SP 16 Non-Dimensional Charts
- 7. Step-by-Step Design & Analysis Procedures
- 8. Pre-Calculated Solved Numerical Examples
- Example 1: First-Principles Analysis of a Column for Given Neutral Axis Depth (xu ≤ D)
- Example 2: Determination of Balanced Failure Condition (Pub, Mub)
- Example 3: Design of Column under Combined Loading using SP 16 Charts
- 9. Engineering Misconceptions & Site Detailing Pitfalls
- 10. Comparative Summary: Compression vs Tension Failure in Columns
- 11. Competitive Exam Traps & High-Yield Takeaways
- 12. Practice Questions & Exercises
- Question 1 (GATE CE)
- Question 2 (UPSC ESE)
- Question 3 (SSC JE / State AE)
1. Introduction & Mechanics of Combined Compression and Bending
In structural frames, reinforced concrete columns rarely experience pure axial compression. Columns carry axial loads () accompanied by bending moments () arising from:
- Unbalanced gravity floor moments transferred through monolithic beam-column framing joints.
- Lateral wind, seismic, or earth pressure forces.
- Significant load eccentricities exceeding the statutory minimum ().
The combined state of stress is statically equivalent to an axial thrust acting at an eccentricity :
                               COMBINED AXIAL & FLEXURAL ACTIONS
                                               │
             ┌─────────────────────────────────┴─────────────────────────────────┐
             ▼                                                                   ▼
   SMALL ECCENTRICITY (xu > D)                                         LARGE ECCENTRICITY (xu ≤ D)
 ┌───────────────────────────────────┐                               ┌───────────────────────────────────┐
 │ • NA lies OUTSIDE the section     │                               │ • NA lies WITHIN the section      │
 │ • Entire cross-section is in      │                               │ • Part in compression, part in    │
 │   compression (no tension)        │                               │   tension (flexural cracking)     │
 │ • Governed by Annex G trapezoidal │                               │ • Governed by parabolic-          │
 │   strain profile (εcu ≤ 0.0035)   │                               │   rectangular stress block        │
 └───────────────────────────────────┘                               └───────────────────────────────────┘
2. Limit State Assumptions & Strain Profiles across Depth (Clause 39.1)
Under IS 456:2000 Clause 39.1, the analysis of compression members subjected to combined axial load and bending is founded upon the following statutory principles:
- Plane Sections Remain Plane: Strain distribution across the cross-section is strictly linear.
- Tensile Strength of Concrete is Neglected: Any concrete in tension is assumed completely cracked.
- Maximum Compressive Strain in Concrete:
- Case 1: Neutral Axis within Section ():
The maximum compressive strain at the highly compressed extreme fiber is fixed at: Tensile strain in steel at effective depth : - Case 2: Neutral Axis outside Section ():
The entire cross-section is under compression. There is no neutral axis within the cross-section, and the strain profile is trapezoidal. Per Clause 39.1(b), the maximum compressive strain at the highly compressed edge is limited to: Where is the compressive strain at the least compressed edge. - Case 3: Pure Axial Concentric Compression (): (Physical Meaning: The strain profile pivots about a point at a depth of from the highly compressed edge where the strain remains fixed at !)
- Case 1: Neutral Axis within Section ():
3. Stress Block Integration & Section Equilibrium (Annex G)
3.1 Case 1: Neutral Axis Within Section ()
When , tension steel exists on the far side. The internal forces are evaluated directly from the standard parabolic-rectangular stress block:
           CROSS SECTION           STRAIN PROFILE             STRESS BLOCK & FORCES
        ┌──────────────────┐          ┌───────┐ 0.0035           ┌──────────┐ 0.446 fck
        │  Asc  (d')       │          │      /│                  │          │◄── Cs = Asc(fsc - 0.45fck)
        │                  │          │     / │                  │          │
        │ ───────┬──────── │ Centroid │    /  │ 0                ├──────────┤◄── Cc = 0.36 fck b xu
        │        │ D/2     │          │   /   │                  │         /
        │        ▼         │          │  /    │                  │        /
   ═════╪══════════════════╪══════════╪═/═════╪══════════════════╪═══════/═════ Neutral Axis (xu)
        │                  │          │/      │                  │
        │  Ast  (d)        │          │\      │                  │
        └──────────────────┘          └─\─────┘ εst              └──────────┘──► Ts = Ast · fst
- Concrete Compressive Force ():
Acting at a centroidal distance of from the highly compressed extreme edge.
- Lever arm about geometric centroid ():
- Moment of concrete compressive force about centroid:
- Compression Steel Force ():
Strain in compression steel located at depth :
Stress is determined from the design stress-strain curve for steel (SP 16 Table A). Net compressive force (deducting concrete displaced by steel area):
- Lever arm about centroid: .
- Moment about centroid:
- Tension Steel Force ( or ):
Strain in tension steel at depth :
Tensile stress . The tensile force is:
- Lever arm about centroid: .
- Moment about centroid:
Notice that a tensile force located below the centroid rotates the section in the same clockwise direction as compression force above the centroid:
- Resultant Axial Force () and Moment ():
3.2 Case 2: Neutral Axis Outside Section ()
When , the entire section is in compression. The stress block covers the full depth . Per IS 456 Annex G:
- The stress block is divided into a rectangular portion () and a parabolic portion depending on the strain ratio:
- Resultant forces and centroidal moments are obtained by integrating the stress profile over depth (tabulated in SP 16 design charts).
4. The Interaction Diagram
The Interaction Diagram is the complete failure envelope representing all possible combinations of ultimate axial load and concurrent bending moment that the column cross-section can withstand.
                      PU - MU INTERACTION DIAGRAM ANATOMY
 ┌─────────────────────────────────────────────────────────────────────────────┐
 │ Axial Load Pu                                                               │
 │       ▲                                                                     │
 │   P0  ● Point A (Pure Axial Concentric: P0 = 0.446 fck Ac + 0.75 fy Asc)    │
 │       │\                                                                    │
 │  Pu,max●─\ Point A' (emin capacity: Pu = 0.40 fck Ac + 0.67 fy Asc)         │
 │       │   \                                                                 │
 │       │    \   COMPRESSION FAILURE REGION (xu > xub)                        │
 │       │     \  • Concrete crushes (εcu = 0.0035)                            │
 │       │      \ • Steel does NOT yield (fst < 0.87 fy)                       │
 │       │       \                                                             │
 │  Pub  ├───────-● Point B: BALANCED FAILURE POINT (Pub, Mub)                 │
 │       │       /│ • εcu = 0.0035 simultaneously with εst = 0.87fy/Es + 0.002 │
 │       │      / │ • Maximum moment capacity occurs here!                     │
 │       │     /  │                                                            │
 │       │    /   │ TENSION FAILURE REGION (xu < xub)                          │
 │       │   /    │ • Ductile flexural failure                                 │
 │       │  /     │ • Steel yields first (fst = 0.87 fy)                       │
 │       │ /      │                                                            │
 │    0  └●───────┴─────────────────────────────────────────► Bending Moment Mu│
 │     Mu0  Point C (Pure Flexure: Pu = 0, Mu = Mu0)        Mub                │
 │       │                                                                     │
 │       ● Point D (Pure Axial Tension: Pu = -0.87 fy Ast)                     │
 └─────────────────────────────────────────────────────────────────────────────┘
4.1 Significant Landmark Points on the Interaction Diagram
- Point A (Pure Axial Concentric Capacity):
Moment is zero (). Axial capacity is governed purely by material compressive strength: - Point A' (Axial Capacity with Minimum Eccentricity):
Accounting for statutory per Clause 39.3: - Point B (Balanced Failure Point):
Occurs at a specific neutral axis depth where concrete reaches its ultimate compressive strain at the exact moment the tension steel reaches its design yield strain :- For Fe 415:
- For Fe 500: The corresponding axial load and moment define the peak flexural strength of the section.
- Point C (Pure Flexure):
Axial load is zero (). The column behaves purely as a doubly reinforced beam with moment capacity . - Point D (Pure Axial Tension):
Moment is zero (). The concrete cracks entirely and the steel resists full tension:
4.2 Failure Modes: Compression Failure vs Tension Failure
┌──────────────────────────────┬────────────────────────────────────────────────────────────────────────┐
│ Failure Mode                 │ Characteristic Structural Behavior                                     │
├──────────────────────────────┼────────────────────────────────────────────────────────────────────────┤
│ Compression Failure          │ • Neutral axis depth xu > xu,b.                                        │
│ (Region AB: Pu > Pub)        │ • Concrete crushes at εcu = 0.0035 while steel has NOT yielded         │
│                              │   (fst < 0.87 fy). Failure is sudden and brittle!                      │
│                              │ • Paradoxical Effect: Increasing axial compression Pu REDUCES          │
│                              │   moment capacity Mu!                                                  │
├──────────────────────────────┼────────────────────────────────────────────────────────────────────────┤
│ Balanced Failure             │ • Neutral axis depth xu = xu,b.                                        │
│ (Point B: Pu = Pub)          │ • Concrete crushes simultaneously as tension steel yields.             │
│                              │ • Moment capacity Mu reaches its absolute maximum peak (Mub).          │
├──────────────────────────────┼────────────────────────────────────────────────────────────────────────┤
│ Tension Failure              │ • Neutral axis depth xu < xu,b.                                        │
│ (Region BC: Pu < Pub)        │ • Tension steel yields (fst = 0.87 fy) prior to concrete crushing.    │
│                              │ • Failure is ductile with extensive cracking and warning deflections.  │
│                              │ • Beneficial Effect: Increasing axial compression Pu INCREASES         │
│                              │   moment capacity Mu! (Compression suppresses tensile cracking).       │
└──────────────────────────────┴────────────────────────────────────────────────────────────────────────┘
5. SP 16 Design Aids Formulation & Non-Dimensional Parameters
To eliminate tedious trial-and-error strain compatibility calculations, the Bureau of Indian Standards published SP 16:1980 (Design Aids for Reinforced Concrete to IS 456), providing non-dimensional interaction curves.
5.1 Non-Dimensional Chart Axes
- Vertical Axis (Axial Load Parameter):
- Horizontal Axis (Bending Moment Parameter):
- Family of Curves (Steel Reinforcement Parameter):
5.2 Governing Parameters for Chart Selection
- Steel Grade: Charts for Fe 250, Fe 415, and Fe 500.
- Cover Ratio (): Standard charts for .
- Reinforcement Distribution Pattern:
- Equal reinforcement on two opposite faces: Charts 27 to 38 (Fe 415).
- Equal reinforcement on all four faces: Charts 43 to 54 (Fe 415).
- Circular columns: Charts 55 to 66 (Fe 415).
6. Engineering Diagrams & Detailing Anatomy
Diagram 1: Column Uniaxial Bending Strain Profiles & Stress Block Integration
The schematic below illustrates the strain profiles, neutral axis locations ( vs ), the pivot at , and stress block force integration about the geometric centroid.
       UNIAXIAL STRAIN PROFILES & STRESS BLOCK (IS 456 CL. 39.5)
 ┌─────────────────────────────────────────────────────────────┐
 │  Case 1: xu ≤ D (NA within Section)                         │
 │  ├── εcu = 0.0035 at top fiber                              │
 │  ├── Parabolic-rectangular concrete stress block (0.446fck) │
 │  └── Pu = Cc + Cs - Ts;  Mu evaluated about centroid D/2    │
 │                                                             │
 │  Case 2: xu > D (NA outside Section)                        │
 │  ├── εc,max = 0.0035 - 0.75 εc,min                          │
 │  ├── Fixed pivot point: ε = 0.002 at depth 3/7 D            │
 │  └── Entire section is in compression (No tension steel)    │
 └─────────────────────────────────────────────────────────────┘
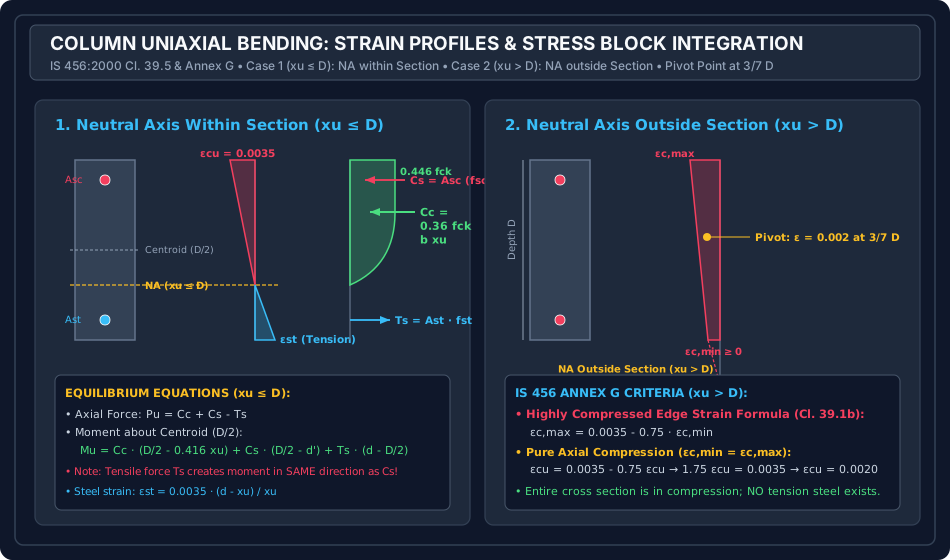
Diagram 2: Uniaxial Interaction Diagram & SP 16 Non-Dimensional Charts
The schematic below illustrates the interaction failure envelope, landmark points (A, A', B, C, D), compression vs tension failure zones, and non-dimensional SP 16 axes ( vs ).
       SP 16 INTERACTION DIAGRAM ANATOMY
 ┌─────────────────────────────────────────────────────────────┐
 │  Pu/(fck·b·D)                                               │
 │       ▲                                                     │
 │       ● Point A: Pure Axial P0                              │
 │       │\                                                    │
 │       │ \  Compression Failure: xu > xub (Concrete Crushes) │
 │       │  \                                                  │
 │       ├───● Point B: Balanced Failure (Pub, Mub)            │
 │       │  /│                                                 │
 │       │ / │ Tension Failure: xu < xub (Ductile Steel Yield) │
 │       │/  │                                                 │
 │       ●───┴────────────────────────────────► Mu/(fck·b·D²)  │
 │     Point C: Pure Bending (Mu0)                             │
 └─────────────────────────────────────────────────────────────┘
7. Step-by-Step Design & Analysis Procedures
               COLUMN UNIAXIAL BENDING DESIGN WORKFLOW (SP 16)
                                     │
 ┌───────────────────────────────────┴───────────────────────────────────┐
 │ 1. Determine Factored Actions: Pu and Mu = Pu · e.                    │
 │ 2. Compute Minimum Eccentricity: emin = max(L/500 + D/30, 20 mm).     │
 │    Check if emin > e; design for Mu = max(Mu,  Pu · emin).            │
 │ 3. Assume Cross-Section Dimensions (b × D).                           │
 │ 4. Select Effective Cover d' & Compute Ratio: d'/D (0.05, 0.10, etc.) │
 │ 5. Compute Normalized Coordinates:                                    │
 │    - Axial Parameter: Pu / (fck · b · D)                              │
 │    - Moment Parameter: Mu / (fck · b · D²)                            │
 │ 6. Select Appropriate SP 16 Chart: Based on steel grade, d'/D, and    │
 │    bar arrangement (2 faces vs 4 faces).                              │
 │ 7. Read Reinforcement Parameter p / fck from Chart.                   │
 │ 8. Calculate Required Steel: Asc = (p / 100) · b · D.                 │
 │ 9. Check Statutory Limits: 0.8% Ag ≤ Asc ≤ 4.0% Ag.                   │
 │ 10. Detail Longitudinal Bars & Lateral Ties per IS 456 Cl. 26.5.3.    │
 └───────────────────────────────────────────────────────────────────────┘
8. Pre-Calculated Solved Numerical Examples
Example 1: First-Principles Analysis of a Column for Given Neutral Axis Depth ()
Problem Statement:
A rectangular reinforced concrete column of size and overall depth is reinforced with bars placed symmetrically with 2 bars on each face parallel to the bending axis (, effective depth ). Materials are concrete M25 () and steel Fe 415 (, ).
For a neutral axis depth ():
- Determine the stresses in compression steel and tension steel.
- Determine the ultimate axial load capacity and concurrent moment capacity about the geometric centroid of the column.
- Calculate the corresponding eccentricity .
Solution:
Step 1: Section Properties and Steel Areas:
- Area of one bar: .
- Compression steel: at .
- Tension steel: at .
- Geometric centroid from either face.
Step 2: Concrete Compressive Force () and Centroidal Moment ():
Centroid of concrete stress block from top fiber:
Lever arm about geometric centroid ():
Step 3: Compression Steel Force () and Centroidal Moment (): Strain in compression steel:
From the Fe 415 design stress-strain curve (SP 16 Table A), interpolating at :
Deducting concrete displaced by steel ():
Lever arm about centroid:
Step 4: Tension Steel Force () and Centroidal Moment (): Strain in tension steel:
Since , the steel is elastic ():
Lever arm about centroid:
Step 5: Total Axial Capacity (), Moment Capacity (), and Eccentricity ():
Corresponding eccentricity:
Example 2: Determination of Balanced Failure Condition ()
Problem Statement:
For the column cross-section analyzed in Example 1 (, Fe 415, M25, bars, ):
- Compute the neutral axis depth at balanced failure ().
- Determine the balanced axial load and balanced moment capacity .
- Calculate the balanced eccentricity .
Solution:
Step 1: Balanced Neutral Axis Depth (): At balanced failure, concrete reaches simultaneously as tension steel reaches yield strain:
Step 2: Concrete Force () and Moment ():
Centroid from top edge: .
Lever arm about centroid (): .
Step 3: Compression Steel Force () and Moment ():
From SP 16 Table A for Fe 415:
Step 4: Tension Steel Force () and Moment (): At balanced failure, tension steel yields ():
Step 5: Balanced Axial Load () and Balanced Moment ():
Balanced eccentricity:
Example 3: Design of Column under Combined Loading using SP 16 Charts
Problem Statement:
Design a square column of size subjected to a factored axial load and a factored uniaxial bending moment . Reinforcement is to be distributed equally on two opposite faces. Clear cover is ().
Materials: Concrete M25 (), Steel Fe 415 ().
Solution:
Step 1: Compute Non-Dimensional Design Parameters:
- Axial Load Parameter:
- Bending Moment Parameter:
Step 2: Read Reinforcement Parameter from SP 16 (Chart 32): From SP 16 Chart 32 (Fe 415, , reinforcement on two opposite faces):
- At and :
Step 3: Determine Required Steel Area ():
Step 4: Bar Selection & Detailing:
Provide equal reinforcement on two opposite faces ( on each face).
Provide (3 bars on each face):
This satisfies statutory bounds: .
9. Engineering Misconceptions & Site Detailing Pitfalls
┌────────────────────────────────────────┬────────────────────────────────────────┬────────────────────────────────────────┐
│ Site Error / Detailing Defect          │ Engineering Consequence                │ IS 456:2000 Mandatory Remedy         │
├────────────────────────────────────────┼────────────────────────────────────────┼────────────────────────────────────────┤
│ Assuming axial load ALWAYS reduces the │ In tension failure (Pu < Pub), adding  │ Recognize the tension failure branch:  │
│ safety of a member                     │ axial load actually INCREASES moment   │ compression suppresses crack opening!  │
│                                        │ capacity by precompressing tension!    │                                        │
├────────────────────────────────────────┼────────────────────────────────────────┼────────────────────────────────────────┤
│ Designing for Mu without checking      │ Out-of-plumbness moments can exceed    │ Always verify design moment:           │
│ minimum eccentricity moment Pu · emin  │ applied moment; risk of corner crack.  │ Mu,design = max(Mu,  Pu · emin).       │
├────────────────────────────────────────┼────────────────────────────────────────┼────────────────────────────────────────┤
│ Selecting wrong SP 16 chart by         │ Errors in steel area up to 40% due to  │ Verify whether steel is on 2 opposite  │
│ confusing 2-face vs 4-face steel       │ incorrect inner lever arm calculation. │ faces (beams) or 4 faces (columns).    │
├────────────────────────────────────────┼────────────────────────────────────────┼────────────────────────────────────────┤
│ Neglecting d'/D cover ratio variation  │ Using d'/D = 0.05 for 0.15 column      │ Calculate d'/D exactly; use linear     │
│ (e.g. assuming fixed d'/D = 0.10)      │ severely under-reinforces the section. │ interpolation between chart sheets.    │
└────────────────────────────────────────┴────────────────────────────────────────┴────────────────────────────────────────┘
10. Comparative Summary: Compression vs Tension Failure in Columns
| Characteristic | Compression Failure () | Tension Failure () |
|---|---|---|
| Axial Force Level | High: | Low to Moderate: |
| Eccentricity Level | Small: | Large: |
| Governing Material | Concrete reaches | Steel reaches yield strain |
| Tension Steel Stress | Does NOT yield () | Yields fully () |
| Failure Warning | Sudden, brittle crushing | Ductile with large cracks and deflection |
| Effect of Adding Axial Load | Reduces moment capacity | Increases moment capacity |
| Neutral Axis Depth | Large (, can exceed ) | Small () |
11. Competitive Exam Traps & High-Yield Takeaways
[!CAUTION] GATE / ESE High-Yield Trap Checklist:
- Peak Moment Location: Maximum moment capacity () occurs at the Balanced Failure Point B, NOT at pure flexure (Point C) and NOT at pure axial load (Point A)!
- Tension Branch Slope: In the tension failure region (), the slope of the interaction curve is positive (). Adding axial compressive load helps the column resist more moment!
- Annex G Pivot Point: For , the strain diagram pivots around a depth of from the highly compressed edge where the compressive strain is fixed at .
- Maximum Strain Formula for : .
- SP 16 Parameter Exponents: Notice the denominators: has to the first power, while has squared!
- Cover Parameter: uses the distance from the extreme compression fiber to the centroid of the longitudinal reinforcement layer.
12. Practice Questions & Exercises
Question 1 (GATE CE)
A short reinforced concrete column is subjected to combined axial compression and uniaxial bending moment . If denotes the balanced axial load capacity, which of the following statements is CORRECT regarding the moment capacity of the column?
- (A) Moment capacity increases as axial load increases when
- (B) Moment capacity increases as axial load increases when
- (C) Moment capacity is independent of the axial load magnitude
- (D) Moment capacity is maximized when the axial load is zero ()
Answer: (B)
Explanation:
When (tension failure zone), failure is initiated by steel yielding. The applied axial compressive force counteracts flexural tension, precompressing the cross-section and thereby increasing the moment carrying capacity until the balanced peak is achieved.
Question 2 (UPSC ESE)
According to IS 456:2000 Clause 39.1(b), when a compression member is subjected to axial load and bending such that the neutral axis lies outside the cross-section (), the maximum compressive strain in concrete at the highly compressed edge is given by:
- (A)
- (B)
- (C)
- (D) under all circumstances
Answer: (A)
Explanation:
Clause 39.1(b) explicitly specifies that the maximum compressive strain at the highly compressed extreme fiber shall be .
Question 3 (SSC JE / State AE)
In the design of columns using SP 16 interaction charts, the non-dimensional parameter plotted on the vertical axis is:
- (A)
- (B)
- (C)
- (D)
Answer: (B)
Explanation:
The vertical axis represents the normalized axial load parameter , while the horizontal axis represents the normalized bending moment parameter .