Airport & Harbor Engineering — Runway Orientation, Basic Runway Length Corrections, Geometric Design, Breakwaters, and Port Structures
In this chapter (1 topics)
On this page
- 1. Module Overview & Technical Architecture
- Airport Infrastructure Systems
- Harbor & Marine Port Systems
- 2. Governing Formulae, Empirical Relations & Code Provisions
- 2.1 ICAO Aerodrome Reference Code (ICAO Annex 14)
- 2.2 ICAO Sequential Runway Length Correction Sequence
- 2.3 Wind Rose Diagram & Crosswind Component Limits
- 2.4 Hudson's Formula for Breakwater Armour Sizing (Coastal Engineering)
- 3. Step-by-Step Analytical Derivations & Mechanisms
- 3.1 Physics of Density Altitude & Runway Length Corrections
- 3.2 Horonjeff's Taxiway Turning Radius Derivation
- 4. Airport Planning, Aircraft Classification & Runway Configuration
- 4.1 Basic Runway Length Definition (FAA / ICAO Criteria)
- 4.2 Runway Configurations & Hourly Capacity
- 5. Runway Orientation, Wind Rose Analysis & Crosswind Limits
- 5.1 Wind Rose Methodology
- 5.2 Determination of Optimal Orientation via Template Method
- 6. Runway & Taxiway Geometric Design Elements
- 6.1 Runway Geometric Elements (ICAO Annex 14 Standards)
- 6.2 Rapid-Exit Taxiways (High-Speed Turnoffs)
- 7. Harbor Planning, Coastal Processes & Littoral Drift
- 7.1 Harbor Classification & Marine Site Selection
- 7.2 Coastal Processes & Littoral Drift
- 8. Maritime Structural Engineering: Breakwaters, Docks, Quays & Fenders
- 8.1 Breakwater Types & Structural Design
- 8.2 Docks, Wharves, Piers & Fendering Systems
- 9. Embedded Technical Visualizations & Diagrams
- 9.1 Airport Runway Orientation, Wind Rose Diagram & Sequential Corrections
- 9.2 Taxiway Geometric Design & Harbor Breakwater Structures
- 10. Worked Analytical & Design Numerical Problems
- Problem 1: Complete ICAO Sequential Runway Length Corrections
- Problem 2: Wind Rose Crosswind Component & Operational Usability Verification
- Problem 3: Taxiway Turning Radius Design (Centrifugal & Horonjeff Criteria)
- 11. Cross-Exam Synthesis Matrix
- 12. Common Failure Modes, Coastal Erosion Diagnostics & Forensic Engineering
- 12.1 Breakwater Armour Displacement & Slope Slumping
- 12.2 Hydroplaning / Aquaplaning on Airport Runways
- 13. Practice Problems & Exam Drill Questions
- Question 1 (GATE Style — NAT)
- Question 2 (UPSC ESE Style — Conceptual Multiple Choice)
- Question 3 (SSC JE / RRB JE Style — Quick Recall)
- 14. Comprehensive Technical Reference & Cross-Topic Linkages
- Inter-Topic Knowledge Mapping
- Standard Code References
1. Module Overview & Technical Architecture
Airport and Harbor Engineering represent the specialized branches of transportation infrastructure catering to high-speed aerial transit and heavy-volume global maritime logistics. Unlike land-based highway and railway corridors governed primarily by topographic grade and rolling friction, aviation and marine facilities interact intimately with atmospheric fluid dynamics, aerodynamic flight envelopes, coastal wave mechanics, astronomical tides, and littoral sediment transport.
Airport Infrastructure Systems
An airport complex is partitioned into two distinct operational domains:
- Airside: Comprises the movement area (runways, taxiways, holding aprons) and surrounding airspace governed by strict obstacle limitation surfaces (OLS per ICAO Annex 14). Structural sizing is dictated by the Critical Aircraft (the most demanding aircraft expected to operate regularly at the facility in terms of maximum takeoff weight, wheel gear configuration, wing span, and approach speed).
- Landside: Encompasses passenger terminals, cargo warehouses, aircraft maintenance hangars, ground access expressways, and multimodal transit interchanges.
Harbor & Marine Port Systems
A port provides a sheltered marine basin protected against destructive storm waves, accommodating commercial vessels for the safe transfer of cargo and passengers between maritime and inland transportation modes:
- Protective Marine Structures: Breakwaters (rubble-mound, vertical caisson, composite) that attenuate wave energy, training walls, groynes, and revetments.
- Berthing & Mooring Infrastructure: Wharves, quays, piers, jetties, dolphins, and fendering systems that absorb vessel berthing kinetic energy.
- Vessel Service & Repair Facilities: Wet docks (enclosed constant-level tidal basins), dry docks (graving docks, floating docks), slipways, and navigational channels maintained by continuous dredging.
                    AIRPORT INFRASTRUCTURE HIERARCHY
                                   │
         ┌─────────────────────────┴─────────────────────────┐
         ▼                                                   ▼
     AIRSIDE                                             LANDSIDE
  • Runways (09/27, 18/36)                            • Passenger Terminals
  • Rapid-Exit Taxiways (30° turnoff)                 • Air Cargo Complexes
  • Aprons & Holding Bays                             • ATC Tower & Radar
  • Runway Safety Areas (RSA/RESA)                    • Multimodal Ground Access

                     HARBOR & PORT STRUCTURAL HIERARCHY
                                   │
         ┌─────────────────────────┴─────────────────────────┐
         ▼                                                   ▼
   OUTER WORKS (Protective)                            INNER WORKS (Berthing/Cargo)
  • Rubble Mound Breakwaters (Tetrapods)              • Quays & Marginal Wharves
  • Vertical Wall Caissons                            • Finger Piers & Jetties
  • Harbor Entrance Channel (Width ~ 0.7 - 1.0 L)     • Wet Docks & Graving Docks
  • Turning Basin (Diameter ≥ 2.0 L)                  • Fenders & Mooring Dolphins
2. Governing Formulae, Empirical Relations & Code Provisions
2.1 ICAO Aerodrome Reference Code (ICAO Annex 14)
ICAO classifies aerodromes using a two-element alphanumeric code based on aircraft performance and physical dimensions:
- Code Element 1 (Numeric): Based on the Aeroplane Reference Field Length (ARFL) under standard sea-level conditions.
- Code 1:
- Code 2:
- Code 3:
- Code 4: (Large commercial jets, e.g., Boeing 777, 787, Airbus A350, A380)
- Code Element 2 (Letter): Based on the aircraft Wingspan and Outer Main Gear Wheel Span (OMGWS).
- Code A: Wingspan , OMGWS
- Code B: Wingspan , OMGWS
- Code C: Wingspan , OMGWS (Airbus A320, Boeing 737)
- Code D: Wingspan , OMGWS (Boeing 767)
- Code E: Wingspan , OMGWS (Boeing 777, Airbus A350)
- Code F: Wingspan , OMGWS (Airbus A380, Boeing 747-8)
2.2 ICAO Sequential Runway Length Correction Sequence
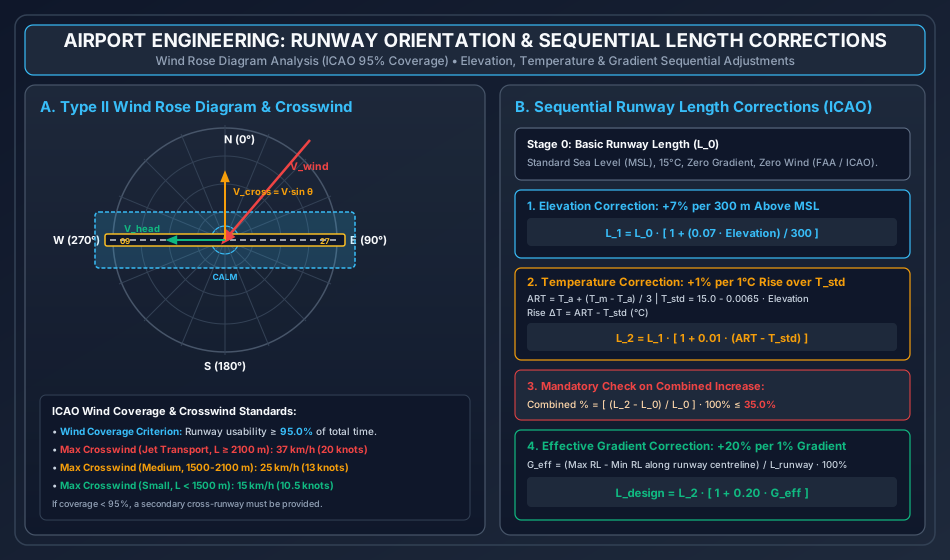
- Elevation Correction: Basic runway length is increased by for every () of elevation rise above Mean Sea Level (MSL):
- Temperature Correction: The elevation-corrected length is further increased by for every by which the Airport Reference Temperature () exceeds the standard atmospheric temperature () at airport elevation :
- Mandatory Check on Combined Elevation + Temperature Increase: (If combined increase exceeds , ICAO mandates specific aeronautical performance flight test simulation).
- Effective Gradient Correction: The temperature-corrected length is increased by for every of Effective Gradient ():
2.3 Wind Rose Diagram & Crosswind Component Limits
The angle between the prevailing wind direction and the runway centreline determines the components:
- Headwind Component: (beneficial, reduces takeoff/landing roll).
- Crosswind Component: (hazardous, induces lateral aerodynamic yaw and drift).
ICAO Permissible Crosswind Velocity Limits ():
- (): For aircraft whose reference field length is (Code 4).
- (): For aircraft whose reference field length is (Code 3).
- (): For aircraft whose reference field length is (Code 1 & 2).
- ICAO Wind Usability Criterion: Runway orientation must ensure a total wind coverage of at least of the time (including calm periods).
2.4 Hudson's Formula for Breakwater Armour Sizing (Coastal Engineering)
Where:
- = Design weight of individual primary armour unit (tonnes or kN).
- = Unit weight of armour material ( for concrete tetrapods, for granite rock).
- = Design wave height at breakwater toe ( or significant wave height, metres).
- = Dimensionless stability coefficient ( for quarry rock, for concrete tetrapods/dolosse).
- = Specific gravity of armour block relative to seawater ().
- = Angle of breakwater seaside slope with the horizontal ().
3. Step-by-Step Analytical Derivations & Mechanisms
3.1 Physics of Density Altitude & Runway Length Corrections
An aircraft generates aerodynamic lift according to the classic Kutta-Joukowski circulation theorem:
Where is ambient air density (), is True Airspeed, is wing planform area, and is the lift coefficient.
- Elevation Effect: Atmospheric air density decreases exponentially with altitude according to the hydrostatic barometric relation (). At higher elevations above MSL, lower air density reduces both aerodynamic lift and jet engine mass-flow thrust. Consequently, the aircraft must achieve a substantially higher True Airspeed () before rotation, prolonging ground roll. Empirical observation over global fleets led ICAO to formalize a uniform expansion of per .
- Temperature Effect: Under Charles's Law at constant barometric pressure (), ambient air density varies inversely with absolute temperature ( in Kelvin): A summer temperature rise above standard atmosphere () causes thermal expansion of air, dramatically lowering density (creating high "density altitude"). This starves jet turbine compressors of oxygen mass and reduces climb performance. ICAO accounts for this thermodynamic penalty by applying a length expansion per excess temperature.
- Effective Gradient Penalty: An aircraft accelerating uphill experiences a constant retarding gravitational component (), diminishing net forward acceleration (). Because kinetic energy is proportional to distance (), an effective uphill grade severely stretches takeoff distance, reflected in the per gradient penalty.
3.2 Horonjeff's Taxiway Turning Radius Derivation
When an aircraft negotiates a sharp taxiway curve, the nose gear is steered along the curved centerline while the main rear landing gear traverses a path of smaller radius (termed Off-tracking).
- Let = radius of taxiway centerline curve ().
- Let = wheelbase of the aircraft (longitudinal distance from nose gear to center of main gear bogie, ).
- Let = outer wheel tread of main landing gear ().
- Let = total width of taxiway paved surface ().
- Let = minimum prescribed safety clearance between the outer tire edge of main gear and the edge of pavement ().
                             Taxiway Pavement Edge
         ───────────────────────────────────────────────────
         ▲                        S (Clearance)
         │           ┌───┐ (Outer Tire)
         │           │   │
  W_tax  │   Centre  └───┘
    / 2  │    Line ────┼──────────────── (R)
         │             │ (Tread T/2)
         │           ┌───┐
         ▼           └───┘
         ───────────────────────────────────────────────────
From circular off-tracking geometry, the radial displacement of the main gear inner path from the nose gear path is given by the Pythagorean offset:
The distance between the taxiway centerline and the outer edge of the main gear tire is:
For the outer tire to maintain safety clearance from the pavement edge:
Rearranging for turning radius yields Horonjeff's formula (incorporating empirical steer-lag correction factor ):
4. Airport Planning, Aircraft Classification & Runway Configuration
4.1 Basic Runway Length Definition (FAA / ICAO Criteria)
The Basic Runway Length () is the minimum uncorrected runway length required by the design aircraft under standard sea-level reference conditions (, , zero longitudinal gradient, zero surface wind, and dry pavement). It is defined as the maximum of three standard flight scenarios:
- Normal Takeoff Condition: The distance required to accelerate to liftoff and clear a () screen height with all engines operating at maximum takeoff thrust, multiplied by a safety factor of :
- Engine Failure Takeoff (Balanced Field Length): The distance required to accelerate to critical engine failure recognition speed (), suffer an abrupt engine flameout, and either:
- Continue takeoff on remaining engine(s) and clear screen height, OR
- Abort takeoff and bring the aircraft to a complete emergency stop within the remaining pavement (Accelerate-Stop Distance). When accelerate-go equals accelerate-stop, the field is termed Balanced.
- Normal Landing Condition: The distance required to clear a () obstacle at threshold speed () and brake to a full stop on a dry runway, divided by an operational safety margin of :
4.2 Runway Configurations & Hourly Capacity
- Single Runway: Capacity operations/hour under Visual Meteorological Conditions (VMC); under Instrument Meteorological Conditions (IMC).
- Parallel Runways:
- Close Parallel (Separation / ): Operations are dependent; landing on one limits departures on the other.
- Medium Parallel ( / ): Independent departures; arrivals dependent.
- Independent Parallel (Separation / ): Simultaneous independent parallel IFR instrument approaches and departures permitted. Capacity doubles to operations/hour.
- Intersecting Runways: Used when winds blow strongly from multiple distinct seasonal quadrants. Capacity depends on intersection location (near threshold vs near mid-length).
5. Runway Orientation, Wind Rose Analysis & Crosswind Limits
5.1 Wind Rose Methodology
To optimize runway orientation, historical meteorological wind records covering a minimum observation window of 5 to 10 years are plotted on a polar diagram:
- Type I Wind Rose: Plots wind direction and percentage duration only. The diagram consists of 16 radial direction lines (each covering an angular sector of : ). The length of each bar represents the percentage of total hours during which wind blew from that direction.
- Type II Wind Rose: Plots direction, duration, AND velocity bands. The diagram is divided into concentric circles representing velocity intervals (e.g., calm, , , , ).
                         N (0°)
                           │
                 NNW       │       NNE
                   \       │       /
             NW     \      │      /     NE
               \     \     │     /     /
         WNW    \     \    │    /     /    ENE
           \     \     \   │   /     /     /
  W (270°) ────────────────┼──────────────── E (90°)
           /     /     /   │   \     \     \
         WSW    /     /    │    \     \    ESE
               /     /     │     \     \
             SW     /      │      \     SE
                   /       │       \
                 SSW       │       SSE
                           │
                         S (180°)
5.2 Determination of Optimal Orientation via Template Method
- A transparent plastic template strip is prepared consisting of three parallel lines:
- A central line representing the trial runway centerline.
- Two outer boundary lines placed symmetrically at a perpendicular distance representing the maximum permissible crosswind component () scaled to the wind rose velocity circles:
- The template center is pinned to the origin of the Type II Wind Rose.
- The template is rotated slowly through . For each trial angle (at or increments), the wind percentages encompassed within the parallel strip boundaries are summed along with the central calm percentage.
- The orientation that yields the maximum total percentage coverage is adopted as the Primary Runway Alignment.
- If the maximum achievable coverage is , a secondary cross-runway must be provided.
6. Runway & Taxiway Geometric Design Elements
6.1 Runway Geometric Elements (ICAO Annex 14 Standards)
| Geometric Element | Code Number 1 & 2 | Code Number 3 | Code Number 4 (Large Jets) |
|---|---|---|---|
| Runway Width | ( for Code 4F / A380) | ||
| Longitudinal Slope (Max) | (First/last quarter ) | ||
| Longitudinal Slope Change | per | per | per () |
| Transverse Cross-Slope | (Cambered crown for drainage) | ||
| Runway Safety Area (RSA) | Width | Width | Width , Length |
| Runway End Safety Area (RESA) | Min | Min | beyond RSA boundary |
6.2 Rapid-Exit Taxiways (High-Speed Turnoffs)
To minimize runway occupancy time (ROT from down to ) and maximize runway capacity, Rapid-Exit Taxiways are provided:
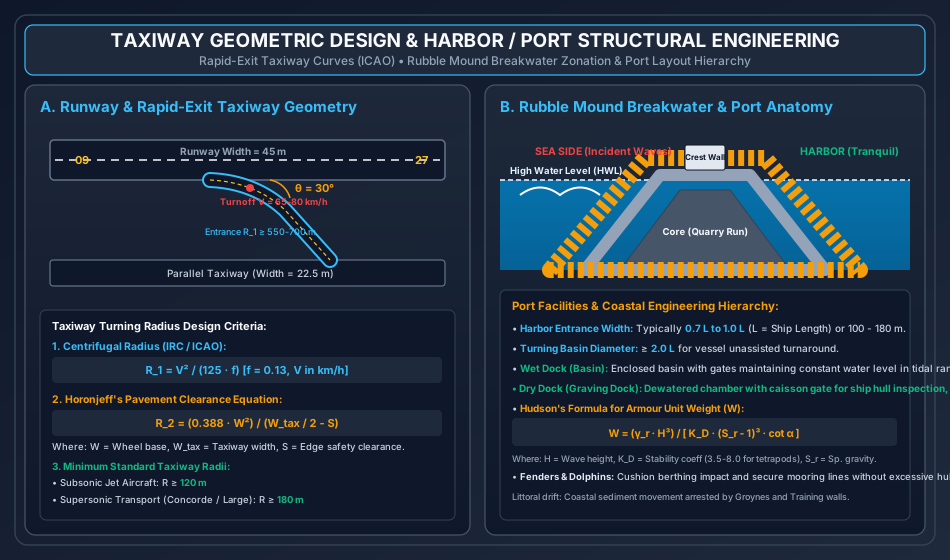
- Turnoff Angle (): Standardized by ICAO at (optimum balance between lateral passenger g-force and steering ease; for small aircraft).
- Turnoff Speed (): Designed for for Code 3 & 4 aircraft ().
- Entrance Curve Radius (): Minimum for Code 4 aircraft to limit lateral centrifugal acceleration ().
- Stopping Distance (): Following the entrance curve, a straight tangent section () is provided before intersection with the parallel taxiway to allow progressive deceleration to .
7. Harbor Planning, Coastal Processes & Littoral Drift
7.1 Harbor Classification & Marine Site Selection
- Natural Harbor: A natural coastal embayment, fjord, or estuary shielded from open-sea waves by topographical peninsulas or offshore barrier islands (e.g., Mumbai, San Francisco, New York).
- Semi-Natural Harbor: A natural cove where modest civil engineering works (jetties, breakwater spurs) augment existing geographical shelter (e.g., Visakhapatnam).
- Artificial Harbor: An open coastline basin enclosed entirely by man-made breakwaters projecting deep into the sea (e.g., Chennai Port, Port of Los Angeles).
7.2 Coastal Processes & Littoral Drift
- Wave Refraction & Shoaling: As ocean swell approaches shallow coastal bathymetry (), wave velocity decreases (), bending wave crests parallel to seabed contours and concentrating wave energy on headlands while dispersing it inside bays.
- Littoral Drift (Longshore Sediment Transport): Waves breaking obliquely at angle to the shoreline generate an alongshore littoral current (). Sand grains are carried along the beach in a continuous zig-zag beach drift.
- When a breakwater or harbor arm is constructed projecting into the sea, it acts as a massive littoral barrier:
- Updrift Side: Massive sand accretion (shoaling), threatening harbor entrance navigability.
- Downdrift Side: Severe coastal sand starvation and destructive shoreline erosion.
- Mitigation: Sand bypassing systems (dredging sand at the updrift trap and pumping it through submerged slurry pipelines to the downdrift beach).
- When a breakwater or harbor arm is constructed projecting into the sea, it acts as a massive littoral barrier:
8. Maritime Structural Engineering: Breakwaters, Docks, Quays & Fenders
8.1 Breakwater Types & Structural Design
             RUBBLE MOUND BREAKWATER CROSS-SECTION

          High Water Level (HWL) ~~~~~~           Crest Wall
   ~~~~~~~~~~~~~~~~~~~~~~~~~~~~~~~~~~~~\      ┌────────┐
        \                               \     │        │
         \   Armour Layer (Tetrapods)    \____│ Concrete│
          \                                   │ Parapet│
           \     Underlayer / Filter           └────────┘
            \   ┌──────────────────────────────┐
             \  │   Core (Quarry Run Rock)     │
              \_│                              │
                └──────────────────────────────┴───────────────
                          Seabed Bedrock
- Rubble Mound Breakwaters:
- The most common and resilient breakwater type, dissipating wave energy through internal friction and turbulence within porous voids.
- Core: Comprises unsorted quarry-run rock ().
- Filter / Secondary Layer: Graded stones () preventing fine core stones from washing out through the outer armour voids.
- Primary Armour Layer: Massive quarried boulders or interlocking unreinforced precast concrete armour units (Tetrapods, Dolosse, Accropodes, Core-Locs; unit weights ). Sized via Hudson's Formula.
- Vertical Wall (Caisson) Breakwaters:
- Reinforced concrete hollow caissons floated to the site, sunk onto a prepared rock foundation bed, and filled with sand ballast.
- Sized to reflect waves rather than dissipate them. Under non-breaking waves, they generate standing waves (Clapotis) doubling wave height () and exerting hydrostatic + dynamic pressure (Sainflou's formula). If waves break against the wall, high-energy impact shock waves occur (Minikin's formula).
8.2 Docks, Wharves, Piers & Fendering Systems
- Wet Docks (Harbor Basins):
- In coastal regions subjected to high tidal variations (, e.g., UK, Bay of Fundy, Hooghly river ports), ships berthed along open quays would ground at low tide. Wet docks enclose berths with lock gates, maintaining a permanent high-water level.
- Dry Docks (Graving Docks):
- Large rectangular excavated masonry/concrete basins equipped with an entrance caisson floating gate. A ship enters at high water, the caisson gate is sealed, and centrifugal dewatering pumps evacuate water, settling the ship gently onto timber keel and bilge blocks for hull maintenance.
- Fenders & Dolphins:
- Fenders: Resilient elastomeric rubber units (cell fenders, cone fenders, pneumatic Yokohama fenders) mounted along quay walls to absorb ship berthing kinetic energy: (where = hydrodynamic virtual mass factor ).
- Breasting Dolphins: Stand-alone pile clusters positioned ahead of wharves to take vessel impact and support fender pads.
- Mooring Dolphins: Pile clusters located behind the berthing line equipped with quick-release mooring hooks to hold ship hawsers.
9. Embedded Technical Visualizations & Diagrams
9.1 Airport Runway Orientation, Wind Rose Diagram & Sequential Corrections
The wind rose analysis method (Type II polar chart), crosswind-headwind vector decomposition, and the sequential four-stage ICAO runway length correction hierarchy are detailed below.
9.2 Taxiway Geometric Design & Harbor Breakwater Structures
The geometry of high-speed rapid-exit taxiway turnoffs ( branch), turning radius criteria, coastal rubble-mound breakwater zonation, and port berthing layout anatomy are illustrated below.
10. Worked Analytical & Design Numerical Problems
Problem 1: Complete ICAO Sequential Runway Length Corrections
Statement: The basic runway length () for an international airport at standard sea-level reference conditions is determined to be . The proposed airport site has the following topographic, meteorological, and geometric characteristics:
- Airport elevation () = above Mean Sea Level (MSL).
- Monthly mean of average daily temperature for the hottest month () = .
- Monthly mean of maximum daily temperature for the same month () = .
- Longitudinal profile along proposed runway centreline:
- Station (Threshold 09):
- Station :
- Station :
- Station (Threshold 27):
- Maximum elevation difference along centerline = across approximate length , giving an effective gradient .
Perform the complete sequential ICAO runway length design:
- Apply the elevation correction to obtain .
- Compute the Airport Reference Temperature (), standard atmospheric temperature at elevation (), and the temperature correction to obtain .
- Execute the mandatory ICAO check on combined elevation and temperature increase ().
- Apply the effective gradient correction to determine the final design runway length ().
Analytical Solution:
Step 1: Elevation Correction Per ICAO Annex 14, increase basic length by per rise above MSL:
Step 2: Airport Reference Temperature & Temperature Correction
- Airport Reference Temperature ():
- Standard Atmospheric Temperature at Elevation (): Taking standard MSL temperature as and standard atmospheric lapse rate of ():
- Temperature Rise ():
- Temperature Correction: Per ICAO, increase by for each rise above standard temperature:
Step 3: Mandatory ICAO Check on Combined Increase Per ICAO guidelines, the cumulative percentage increase from elevation and temperature combined must not exceed :
(Because the combined increase is within the threshold, standard empirical gradient corrections proceed directly without requiring special aeronautical flight tests).
Step 4: Effective Gradient Correction Given effective gradient . Per ICAO, increase by for each effective gradient:
Problem 2: Wind Rose Crosswind Component & Operational Usability Verification
Statement: A proposed runway is aligned along the East-West axis: Runway 09-27 (True azimuths and ). The airport is designed for Code 4 wide-body jet aircraft with a basic runway length exceeding . Meteorological analysis reveals a dominant storm wind blowing from direction (True azimuth ) at a sustained velocity of . Determine:
- The angle () between the wind direction and the runway centerline.
- The resolved crosswind component () and headwind component ().
- Verify whether this storm wind condition satisfies the ICAO maximum allowable crosswind limit for this category of aircraft.
Analytical Solution:
Step 1: Angle Between Wind Vector & Runway Centerline () The runway centerline azimuth is (for Runway 09 landing toward the east). The wind blows from azimuth :
Step 2: Crosswind & Headwind Components
- Crosswind Component ():
- Headwind Component ():
Step 3: Compliance with ICAO Limits For Code 4 aircraft ():
Comparing the actual crosswind with the allowable limit:
Operational Assessment: While fully safe for large jet aircraft, this crosswind would exceed the limits for smaller feeder aircraft () and medium transport (). Therefore, if regional turboprop feeder operations are planned at this hub, a secondary cross-runway must be provided to ensure 95% overall fleet usability.
Problem 3: Taxiway Turning Radius Design (Centrifugal & Horonjeff Criteria)
Statement: Sizing a high-speed rapid-exit taxiway curve for a large commercial transport aircraft (Airbus A350 class) operating under the following design parameters:
- Design turnoff speed () = .
- Pavement-tire lateral coefficient of friction () = .
- Aircraft wheelbase () = .
- Aircraft wheel tread () = .
- Taxiway paved width () = .
- Minimum required edge safety clearance () = .
Calculate the required minimum radius of the taxiway curve () considering:
- Centrifugal acceleration criteria ().
- Horonjeff's off-tracking geometry criteria ().
- The ICAO absolute minimum radius recommendation for this aircraft class, and state the governing design radius to be adopted.
Analytical Solution:
Step 1: Centrifugal Turning Radius () Balancing centrifugal lateral force against tire friction without banking the taxiway:
Given and :
Step 2: Horonjeff's Off-Tracking Geometry Radius () Using Horonjeff's formula to guarantee edge clearance :
Substitute the design values:
- Numerator
- Denominator
Step 3: Adopted Design Radius
- Centrifugal requirement: .
- Pavement edge clearance requirement: .
- ICAO absolute recommended minimum radius for large subsonic jet aircraft: (and for supersonic transport).
The design radius is strictly governed by the centrifugal operational speed:
11. Cross-Exam Synthesis Matrix
| Exam | High-Frequency Conceptual Focus | Typical Calculation Types | Priority Traps & Critical Nuances |
|---|---|---|---|
| GATE CE | • Sequential order of runway length corrections • combined elevation + temperature check • Crosswind component formula () • Taxiway turning radius () |
• Numerical Answer Type (NAT) runway length sequential calculation • Horonjeff taxiway radius equation • Airport reference temperature () |
• Corrections MUST be applied sequentially (), NEVER added in parallel as percentages of ! • Standard temperature decreases with altitude (); do not add the lapse rate! • Check the threshold before applying gradient correction. |
| UPSC ESE | • Full derivation of Horonjeff's taxiway formula • Type I vs Type II wind rose diagrams • Hudson's formula for rubble mound breakwaters • Wet docks vs Dry graving docks mechanics |
• Conventional 15-mark runway design problems • Breakwater armour unit sizing () • Rapid exit taxiway layout and fillet dimensions |
• Hudson's formula: Remember the cubic power on and • In formula, denominator is , NOT • Distinguish between Significant Wave Height () and design wave height. |
| SSC JE / RRB JE | • ICAO runway width standards ( for Code 4) • Wind coverage criterion ( usability) • Crosswind limits (, , ) • Harbor structures (Quay, Pier, Dolphin, Breakwater) |
• Direct percentage substitution for elevation (+7%/300m) and temperature (+1%/1°C) • Effective gradient calculation () • Basic crosswind component |
• Do not confuse Headwind (beneficial) with Crosswind (hazardous) • Calm period percentage is ADDED to directional coverage on wind rose • Breakwater protects harbor; Groyne protects shoreline from beach drift. |
| State AE / PSU | • Obstacle limitation surfaces (Approach surface, Transitional surface, Conical surface) • Airport zoning laws and height restrictions • Dredging equipment types (Suction cutter, Bucket ladder, Dipper dredge) |
• Quick calculation of corrected runway length • Vessel turning basin diameter () • Harbor entrance width () |
• Effective gradient correction is per gradient (not or ) • Turning basin diameter must be at least twice the ship length without tugs. |
12. Common Failure Modes, Coastal Erosion Diagnostics & Forensic Engineering
12.1 Breakwater Armour Displacement & Slope Slumping
- Failure Phenomenon: During extreme cyclonic wave attacks, primary concrete armour units (tetrapods/dolosse) rock, fracture, or are rolled down the seaside slope, exposing the fine rock core to direct hydraulic wave blasting, leading to catastrophic breach.
- Root Cause & Forensic Diagnosis:
- Wave height exceedance () due to climate-change-induced sea level rise and intensified cyclonic storm tracks.
- Structural fatigue of slender armour legs (dolos units are vulnerable to waist impact fracture under rocking).
- Insufficient toe berm support, allowing the toe stones to scour and trigger rotational mass sliding of the entire armour blanket.
- Site Remediation:
- Over-laying with interlocking single-layer massive concrete blocks (e.g., Accropode II or Xbloc) featuring higher stability coefficients ().
- Reinforcing the underwater toe berm with heavy scour aprons and geotextile mattresses.
12.2 Hydroplaning / Aquaplaning on Airport Runways
- Failure Phenomenon: During heavy monsoonal rain, high-speed landing aircraft experience complete loss of tire traction and directional control, sliding off the runway end or veer off into the side safety area.
- Mechanics of Dynamic Hydroplaning:
- Standing water thickness () exceeds the tire tread drainage capacity.
- Dynamic water pressure builds ahead of the tire, lifting the rubber completely off the pavement.
- Critical dynamic hydroplaning speed:
- Forensic Diagnostics & Countermeasures:
- Precision runway grooving: Transverse sawing of rectangular grooves ( at pitch) across the runway surface, reducing hydrodynamic pressure buildup by .
- Maintaining transverse crown cross-slope of .
13. Practice Problems & Exam Drill Questions
Question 1 (GATE Style — NAT)
The basic runway length of an airport at sea level under standard conditions is . The airport site is located at an altitude of above MSL. If the airport reference temperature () is and standard temperature at MSL is , the runway length corrected for elevation and temperature (before gradient correction) is . (Round off to the nearest integer).
- Answer:
- Explanation:
- Elevation correction: .
- Standard temperature at : .
- Rise .
- Temperature correction: .
- Check combined: .
- Let's verify calculation: .
Question 2 (UPSC ESE Style — Conceptual Multiple Choice)
Consider the following statements regarding Airport and Harbor Engineering:
- The total wind coverage on a wind rose diagram must not be less than for permissible crosswinds.
- In Hudson's formula for breakwater armour weight, the weight is directly proportional to the cube of the wave height.
- The standard exit angle for high-speed rapid-exit taxiways is .
- The correction for effective gradient increases the runway length by for every gradient.
Which of the above statements are CORRECT?
- Options: (a) 1, 2, and 3 only (b) 1, 2, and 4 only (c) 2 and 4 only (d) 1, 3, and 4 only
- Correct Answer: (b) 1, 2, and 4 only
- Explanation: Statement 3 is incorrect because the standard ICAO turnoff angle for high-speed rapid-exit taxiways is (not ). Statements 1, 2, and 4 are completely correct.
Question 3 (SSC JE / RRB JE Style — Quick Recall)
A harbor structure constructed parallel to the shoreline to accommodate ships on one side and cargo handling on the landward side is called a:
- Options: (a) Pier (b) Groyne (c) Quay / Marginal Wharf (d) Breakwater
- Correct Answer: (c) Quay / Marginal Wharf
- Explanation: A Quay (or marginal wharf) is built parallel and contiguous to the shoreline, providing direct vehicular and crane access on the land side and berthing along the sea face.
14. Comprehensive Technical Reference & Cross-Topic Linkages
Inter-Topic Knowledge Mapping
- Upstream Linkages:
FM-01toFM-08: Fluid mechanics principles (aerodynamic lift, Bernoulli's equation, boundary layer drag on wings and ship hulls).TRANS-01toTRANS-04: Geometric design parallels, subgrade CBR, flexible/rigid pavement design for airport runways.GEOTECH-01toGEOTECH-08: Coastal marine soil mechanics, soft clay consolidation under breakwater mounds, caisson bearing capacity.
- Concurrent & Downstream Linkages:
SURV-01toSURV-08: Geomatics, GPS, photogrammetry, remote sensing for airport zoning obstacle limitation surveys.CPM-01: Construction planning and fast-track concrete slipform paving for airport runways.
Standard Code References
- ICAO Annex 14 (Volumes I & II): Aerodromes — Aerodrome Design and Operations, International Civil Aviation Organization.
- FAA Advisory Circular 150/5300-13B: Airport Design, Federal Aviation Administration, USA.
- IS 4651 (Parts 1-5): Code of Practice for Planning and Design of Ports and Harbors, Bureau of Indian Standards.
- US Army Corps of Engineers (USACE): Coastal Engineering Manual (CEM), Engineering and Design.